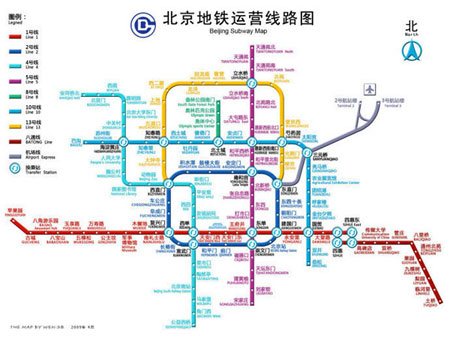
b) This is a Road Map of Beijing Subway Lines in 2009. There were 9 lines at the time and they connected major spots in Beijing.
c) I find this map interesting because I think this subway map is a good reflection of basic formation of Beijing city and clearly shows the square formation of the city. Modern Beijing city started to develop around Forbidden City, a square royal city at the heart of Beijing. And all the major roads in Beijing were built in this square format, which leads to the final Square-like city. Because Beijing has limited resources for subway-building, all the places on the subway lines are very important spots that can be considered as representatives of Beijing, so subway map of Beijing is a good reflection of Beijing city formation.

a) Source: http://projects.latimes.com/homicide/map/, Los Angeles Times, 2007
b) This is a map view visualizing crime incidents in Los Angeles County.
c) I find this map interesting because this map has several layers and contains lots of information, yet all the information is well organized thus enables us to analyze the traits and causes of homicide crimes in Los Angeles. We can see from the crime map that the "cause" layer clearly shows that deaths caused by gunshot occupy a large proportion of all the homicide crimes, and the "race" layer shows Hispanic and Black people are major victims for homicide crimes. And there's also information not showed by these layers, for example, we can judge from the density of the "cause" layer marks that the crime rate varies tremendously in different areas. I think this "crime map" can be used in real life to help analyze and prevent crimes.

a) Source: Item 1250826 on AllPoster.com.au. Link: http://www.allposters.com.au/-sp/Ancient-Civilizations-Map-Timeline-posters_i1250826_.htm
b) This is a map of Ancient Civilizations and Timeline.
c) I find this map interesting because it turns out that one single map can be used to visualize changes in a long period of time. We usually think that in order to show a series of variations on a timeline we need to use a series of pictures, but actually we can do it smartly in just one map using different colors and legends which illustrate the meanings of colors. So maps can be very powerful to show and analyze changes taking place in a long period of time.
No comments:
Post a Comment